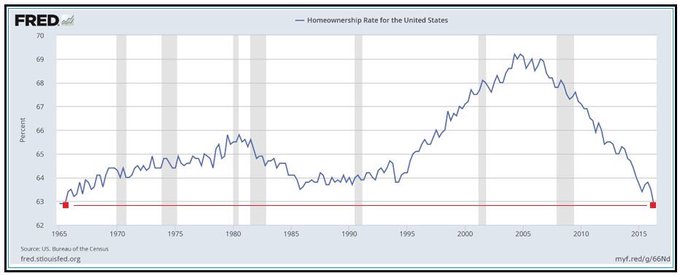
The recent bit of housing news to get the most attention was the Census Bureau’s announcement that the U.S. homeownership rate has declined to 62.9%–the lowest rate since Census began tracking the quarterly figure in 1965. The news prompted this tweet from real estate billionaire turned Republican presidential nominee Donald Trump:
Fact-checking website Politifact gave the tweet a “mostly true” rating, a rare feat for the candidate whose statements the site has rated “ false” or “pants on fire” 55% of the time (15% of his statements rate “ true” or “mostly true”). Economists can’t argue with the statistic, but don’t necessarily see the situation as starkly as Trump’s tweet implies.
Jonathan Smoke, chief economist at Realtor.com, points out that the homeownership rate is a lagging indicator. So the latest data only confirms housing trends that have been observed for some time. The national homeownership rate peaked at around 69% from 2004 through 2006 and has been waning ever since. In fact the drop from the year-ago rate (63.4%) is not statistically significant, even if it is psychologically. ”Homeownership has been declining in part because it was artificially high,” says Smoke, noting that the rate had to come down to support responsible lending practices.
Demographics also play a role, he says. People are most likely to own homes from ages 25 to 75. With Boomers entering their post-homeownership years and Millennials still in their pre-homeownership years, a natural cycle is playing out.
Recommended by Forbes
This is why Ralph McLaughlin, chief economist at home search site Trulia, says he’ll be paying particular attention to Generation X, currently ages 36 to 51. People in this cohort lost homes at a disproportionate rate during the recession and have been slow to come back, despite being in the typical homeownership sweet-spot with children and careers. The ownership rate for people ages 35 to 44 was up slightly year-over-year in the second quarter to 58.3%. The bump is not yet statistically significant, but McLaughlin hopes it’s the start of a positive trend.
Millennials, currently 18 to 35, are more commonly blamed for the ownership decline but McLaughlin offers a more positive take. The latest dip in ownership, broadly and for Millennials specifically, was due to an increase in renter households rather than a decrease in owner households. In other words, the total number of households increased.
“Certainly low inventory and affordability isn’t helping their efforts to own, but Millennials moving out of their parents’ basement and into a rental unit is also a good sign for the housing market,” says McLaughlin.
Other housing market data released last month shows that home prices and sales have grown in the last year, but inventory remains low. Looking ahead, there are signs that sales may slow as supply and affordability diminish further.
“Sustained job growth as well as this year’s descent in mortgage rates is undoubtedly driving the appetite for home purchases,” said Lawrence Yun, chief economist for the National Association of Realtors, in a late July release. ”Looking ahead, it’s unclear if this current sales pace can further accelerate as record high stock prices, near-record low mortgage rates and solid job gains face off against a dearth of homes available for sale and lofty home prices that keep advancing.”
The data…
Prices: Home prices have steadily grown at roughly a 5% annual rate since the start of 2015. The latest release of the S&P CoreLogic Case-Shiller U.S. National Home Price Index shows that May was no exception. Meanwhile, NAR says the median existing-home price in June was $247,700. Up 4.8% from a year earlier, June marked the 52nd consecutive month of year-over-year price gains. According to the U.S. Census Bureau the median sale price of new homes sold that month was $306,700.
McLaughlin notes that the pace at which prices are rising is slowing. Looking ahead he expects prices to continue to flatter or drop further.
Sales: Even at elevated prices homes changed hands at a steady pace in June. Existing-home sales increased for the fourth consecutive month, gaining 3% from June 2015 to a seasonally adjusted annual rate of 5.57 million. (This means if the June pace of sales held for 12-months 5.57 million homes would be sold for the year.) Sales remained at their highest annual pace since February 2007. New singles-family homes sold at a seasonally adjusted annual rate of 592,000.
NAR’s Pending Home Sales Index saw minor year-over-year improvement in June, but is down substantially from its April peak. NAR now expects existing-home sales to be around 5.44 million for the year. This would be the highest annual pace since 2006, but the rate growth is slowing.
Inventory: The Census Bureau estimates there were 244,000 new homes for sale at the end of June, representing a 4.9 month supply at the current sales rate. NAR put existing-home inventory at at 2.12 million, that’s a 5.8% decline from a year ago and a 4.6 month supply.
Building permits and housing starts are both down sharply from a year ago, meaning new construction is unlikely to boost supply this year. Smoke notes that new listings typically peak in April or May. This year June listings were also strong, but preliminary data suggests July listings returned to normal levels.
Mortgage rates: Following the United Kingdom’s June 23rd vote to leave the European Union many experts predicted U.S. mortgage rates would soon reach all-time lows. This didn’t quite happen, but it was close. The 30-year fixed-rate hit a record low of 3.31% in 2012 and is currently about 3.56%. In July it sank as low as 3.52%. Experts expect rates to remain low for the foreseeable future.


No hay comentarios.:
Publicar un comentario